Composite risk scores for every US county and ZIP code — natural hazard, crime, road safety, income, health and environment — built entirely from official government data.

Type a ZIP code or county name — no signup needed. This is real data straight from the API.
Loading Travis County, TX…

See the full risk picture for any US neighborhood before you sign — natural hazards, crime, road safety, income, home values, health, environment and disaster history — in one clear, downloadable PDF.
One-time, USD or CAD. Or explore the free grade and component scores for any county first. How the score works →
One county lookup returns 30+ fields across nine categories — hazard, safety, income, health, environment and more. See the full data catalog →
18 FEMA perils — wildfire, hurricane, tornado, earthquake, flood, hail, heat, drought and more, at county and ZIP level.
Fatal crashes, fatalities and population-adjusted rates from NHTSA, 2020–2022.
Violent and property crime rates per 100k from the FBI, county and state level.
Median household income, median home value and poverty rate from the US Census.
Adult obesity, depression, smoking and uninsured rates from CDC PLACES.
Hospital counts, CMS quality star ratings and HRSA primary-care shortage areas.
EPA Superfund sites and toxic-release facilities.
Federal disaster declarations since 2000 and NOAA storm event counts.
Crime Severity Index plus median and average household income for 56 provinces and metros.
Wildfire, flood, severe storms, dangerous roads and the strength of local health care — RiskIndex scores the forces that actually shape a place, drawn from FEMA, NOAA, NHTSA, CDC and HRSA records.
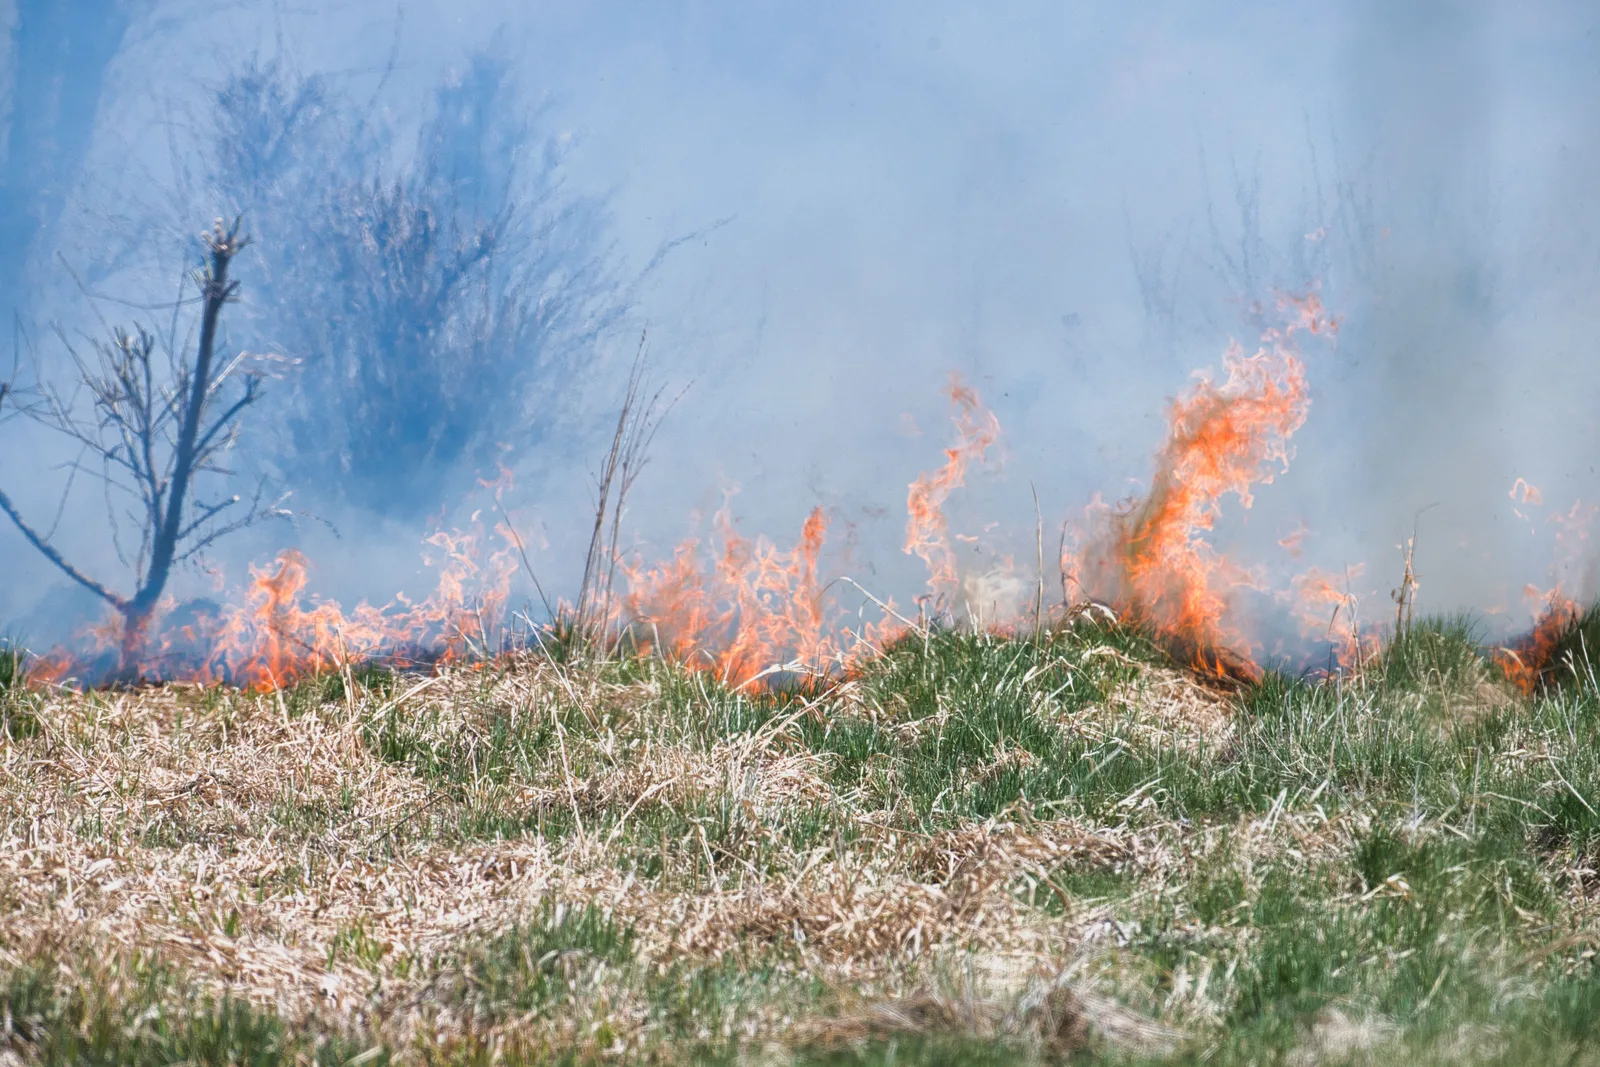 Wildfire & extreme heat
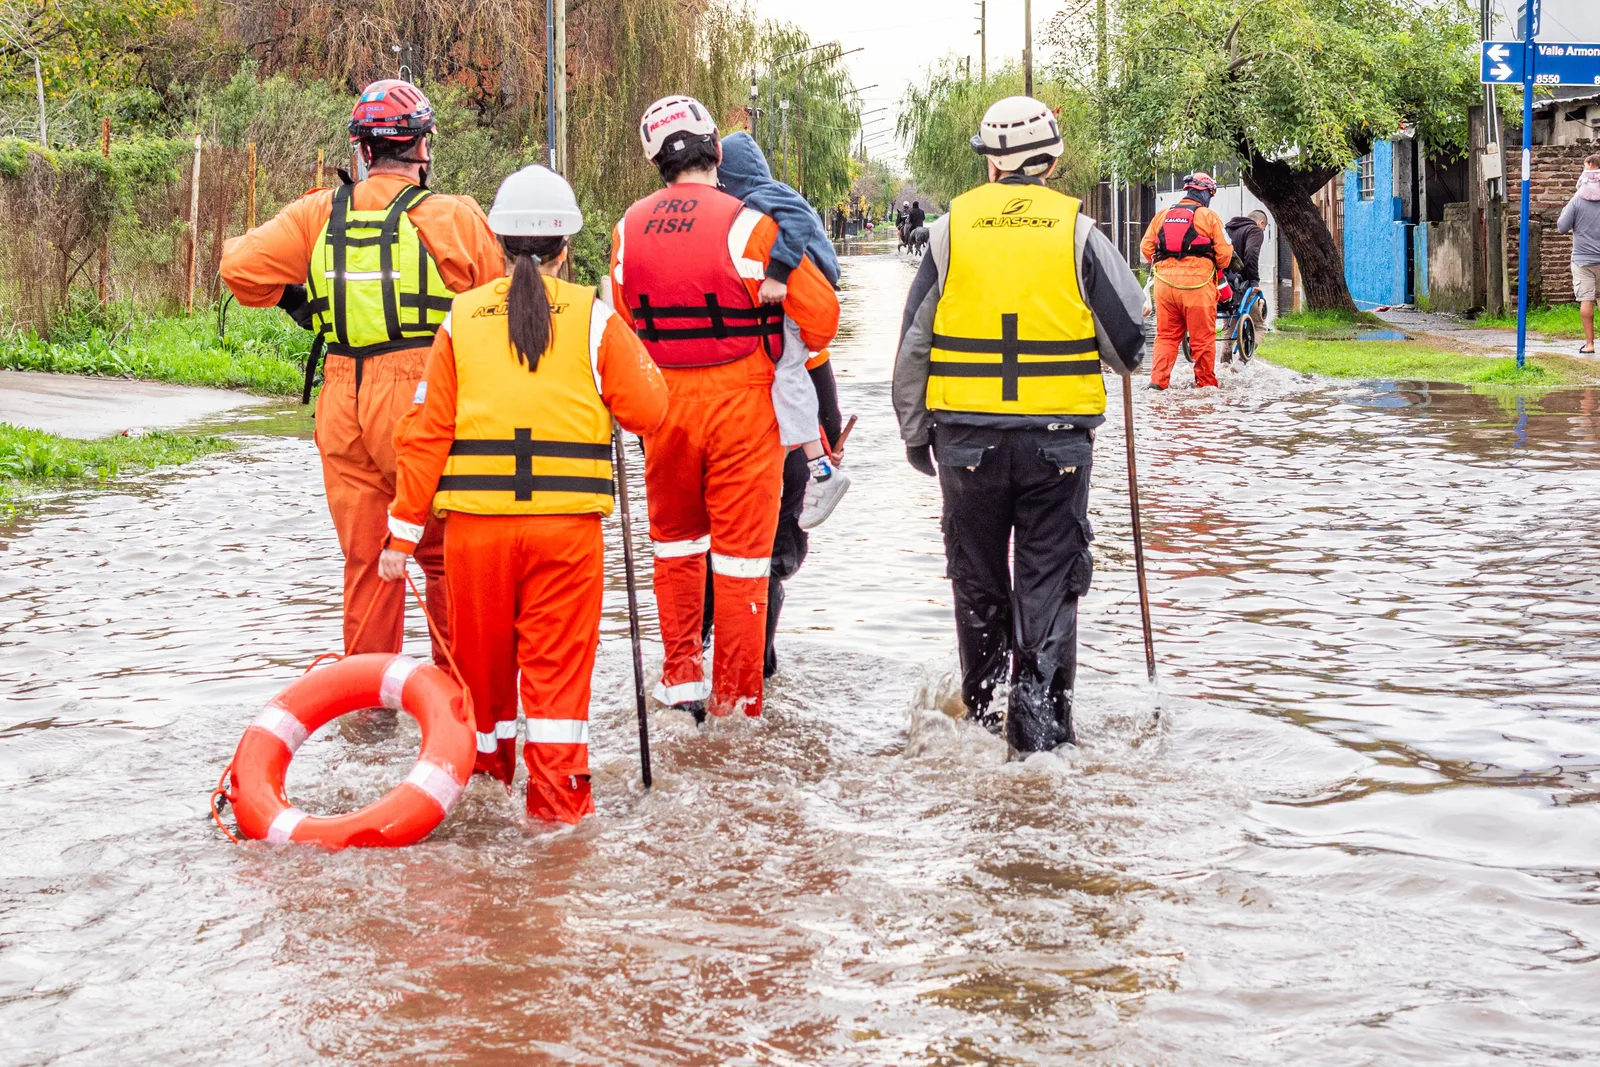 Flood & severe storms
 Road safety
 Health & care access
3,144 counties, 33,354 ZIP codes and 85,154 census tracts — so a hazard score reflects the neighbourhood, not just the county line.
One API call returns hazard, crime, road-safety, income, health and environmental context for any US location. See API & pricing →
Enrich underwriting and pricing with FEMA hazard scores, wildfire and flood exposure, crime and fatal-crash rates — down to the ZIP.
Show buyers the full picture: hazard grade, disaster history, median income and home value, plus neighborhood safety context.
Environmental Superfund and toxic-release sites, disaster declarations, and defensible government-sourced figures for filings and diligence.
Care-access shortages (HRSA), CDC health outcomes, hospital quality and income data by county for planning, outreach and grants.
No scraped or proprietary data. Ever. See exactly where each figure comes from and when we last refreshed it on our Data Sources page.
See the free grade in seconds. Unlock the full household report — all hazards, crime, income, health, environment and a downloadable PDF — for $9.99.
Run your household report